🧭 Explore
The Explore section is where all design variants generated in InForm are brought together for comparison and evaluation.
It uses the ParameterSpace configuration to display and analyse both manually explored variants and those generated via Batch Jobs.
This area is designed to help users move from individual design inspection to systematic comparison across the entire solution space.
What You Can Do in Explore
Within Explore, users can:
- Explore variants generated from different input combinations
- Filter and sort options using performance-driven criteria
- Review KPIs across multiple dimensions simultaneously
- Support informed decision-making through data-driven comparison
Each variant displayed in Explore corresponds to a unique combination of inputs and outputs computed by the model.
What is a Parallel Coordinates Chart?
A Parallel Coordinates Chart is a visualisation technique used to inspect high-dimensional data (data with many variables).
Instead of using a traditional 2D or 3D plot, it represents each variable as a vertical axis:
- Each axis corresponds to one variable (e.g., Input: Floor Count, Output: GFA, Output: Embodied Carbon).
- Each design variant is represented as a polyline that crosses every axis at the value of that variant for that variable.
- By looking at the “shape” and distribution of many polylines, it becomes possible to spot patterns, trade-offs, clusters, and outliers.
Why it is useful in InForm
In design optimisation and optioneering, the key problem is that each variant has many competing metrics.
A Parallel Coordinates Chart is well suited to this because it allows users to:
- Compare many variants across multiple KPIs at the same time (not just 1–2).
- Identify trade-offs (e.g., lower Embodied Carbon often correlates with lower GFA).
- Find outliers (variants that perform unexpectedly well or poorly).
- Filter the design space by selecting preferred ranges (e.g., “top 20% GFA” and “bottom 20% Embodied Carbon”).
- Move from “looking at one option at a time” to “understanding the full solution space”.
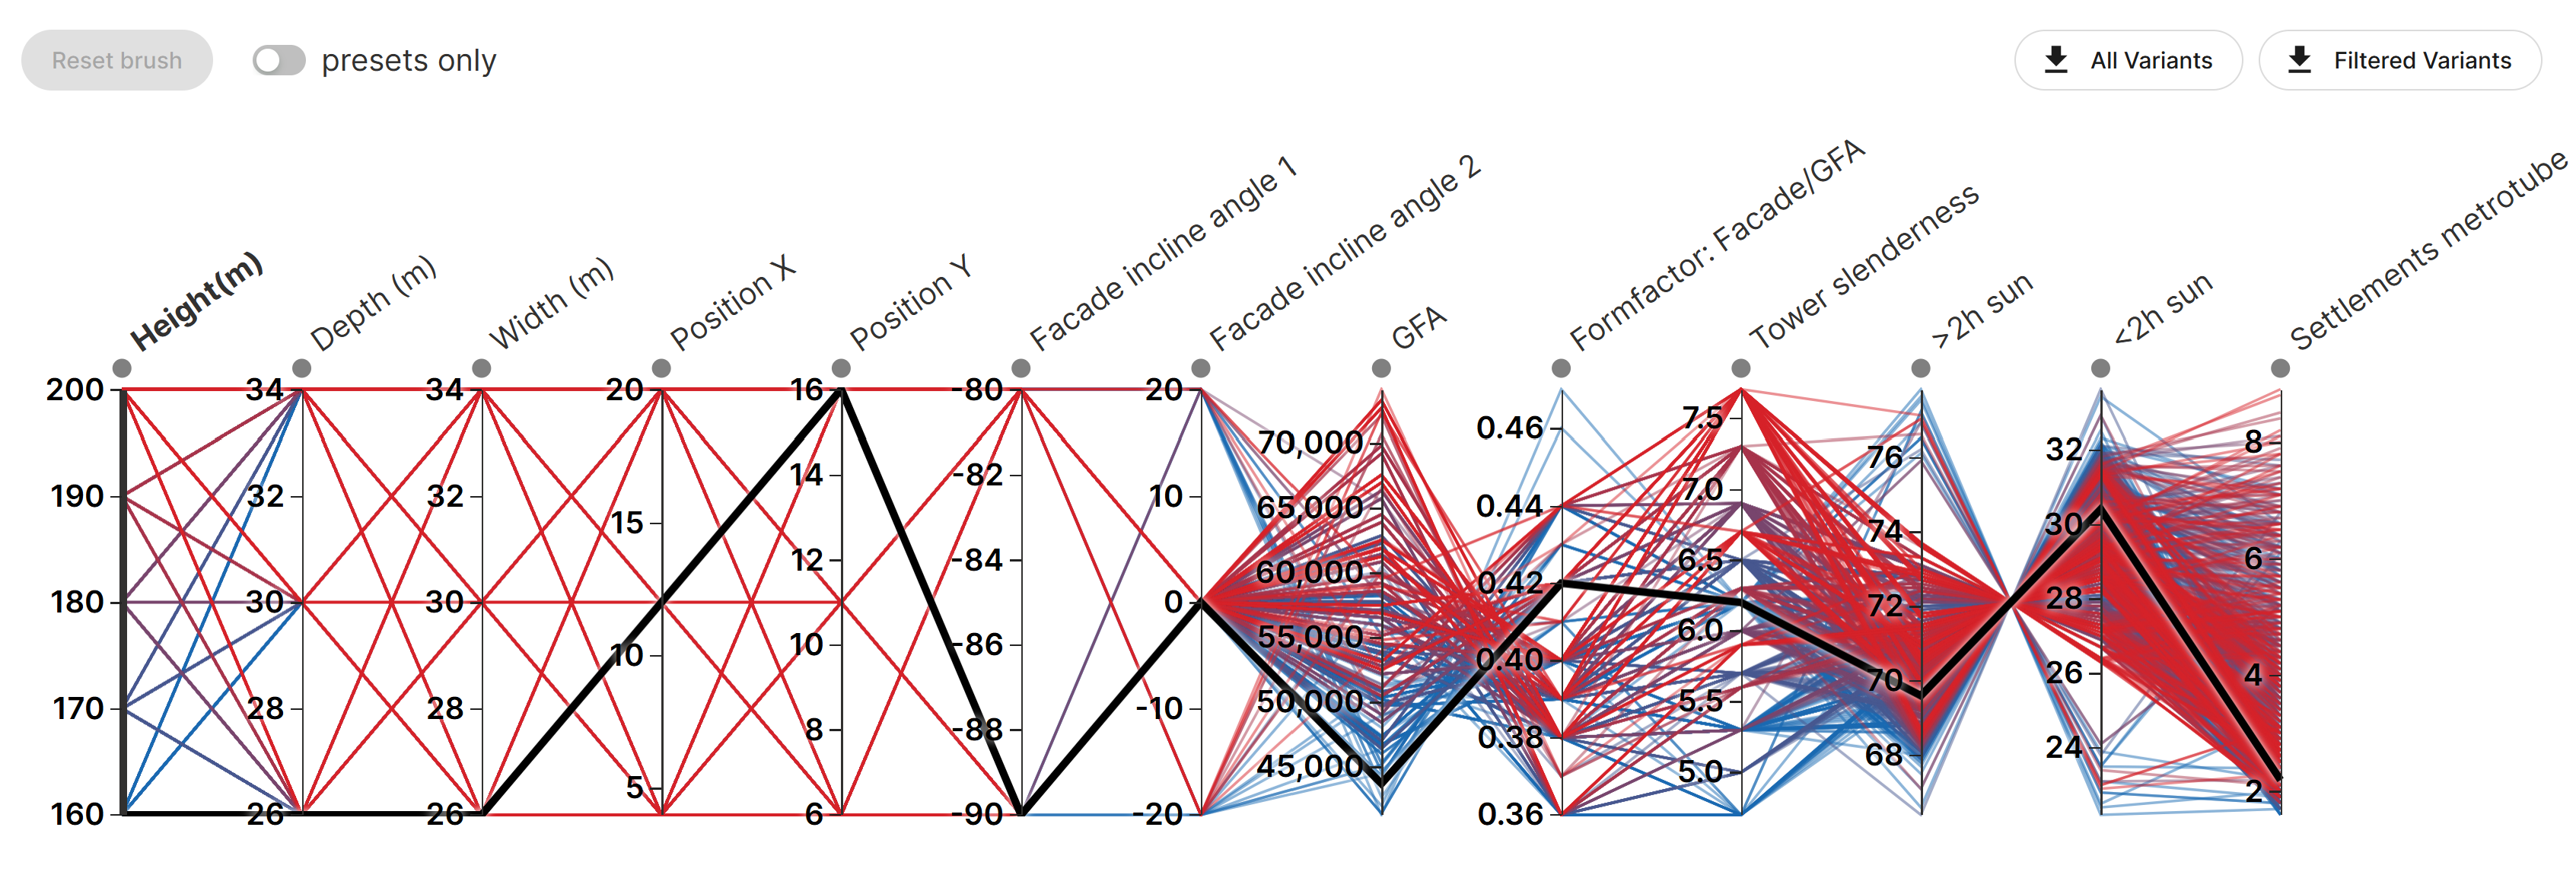
Filtering Variants Using the Chart
The main chart (Parallel Coordinates Chart) allows interactive filtering:
- Each vertical axis represents an Input or an Output
- Each line represents a single design variant
To filter variants:
- Click and drag on one or more axes to define a value range
- Example:
- Low Embodied Carbon
- High GFA
- Example:
- Multiple filters can be applied simultaneously across different axes
Only variants satisfying all active filters will remain visible.
The filtered list of variants will appear in the bottom panel, showing only the options that meet the selected criteria.
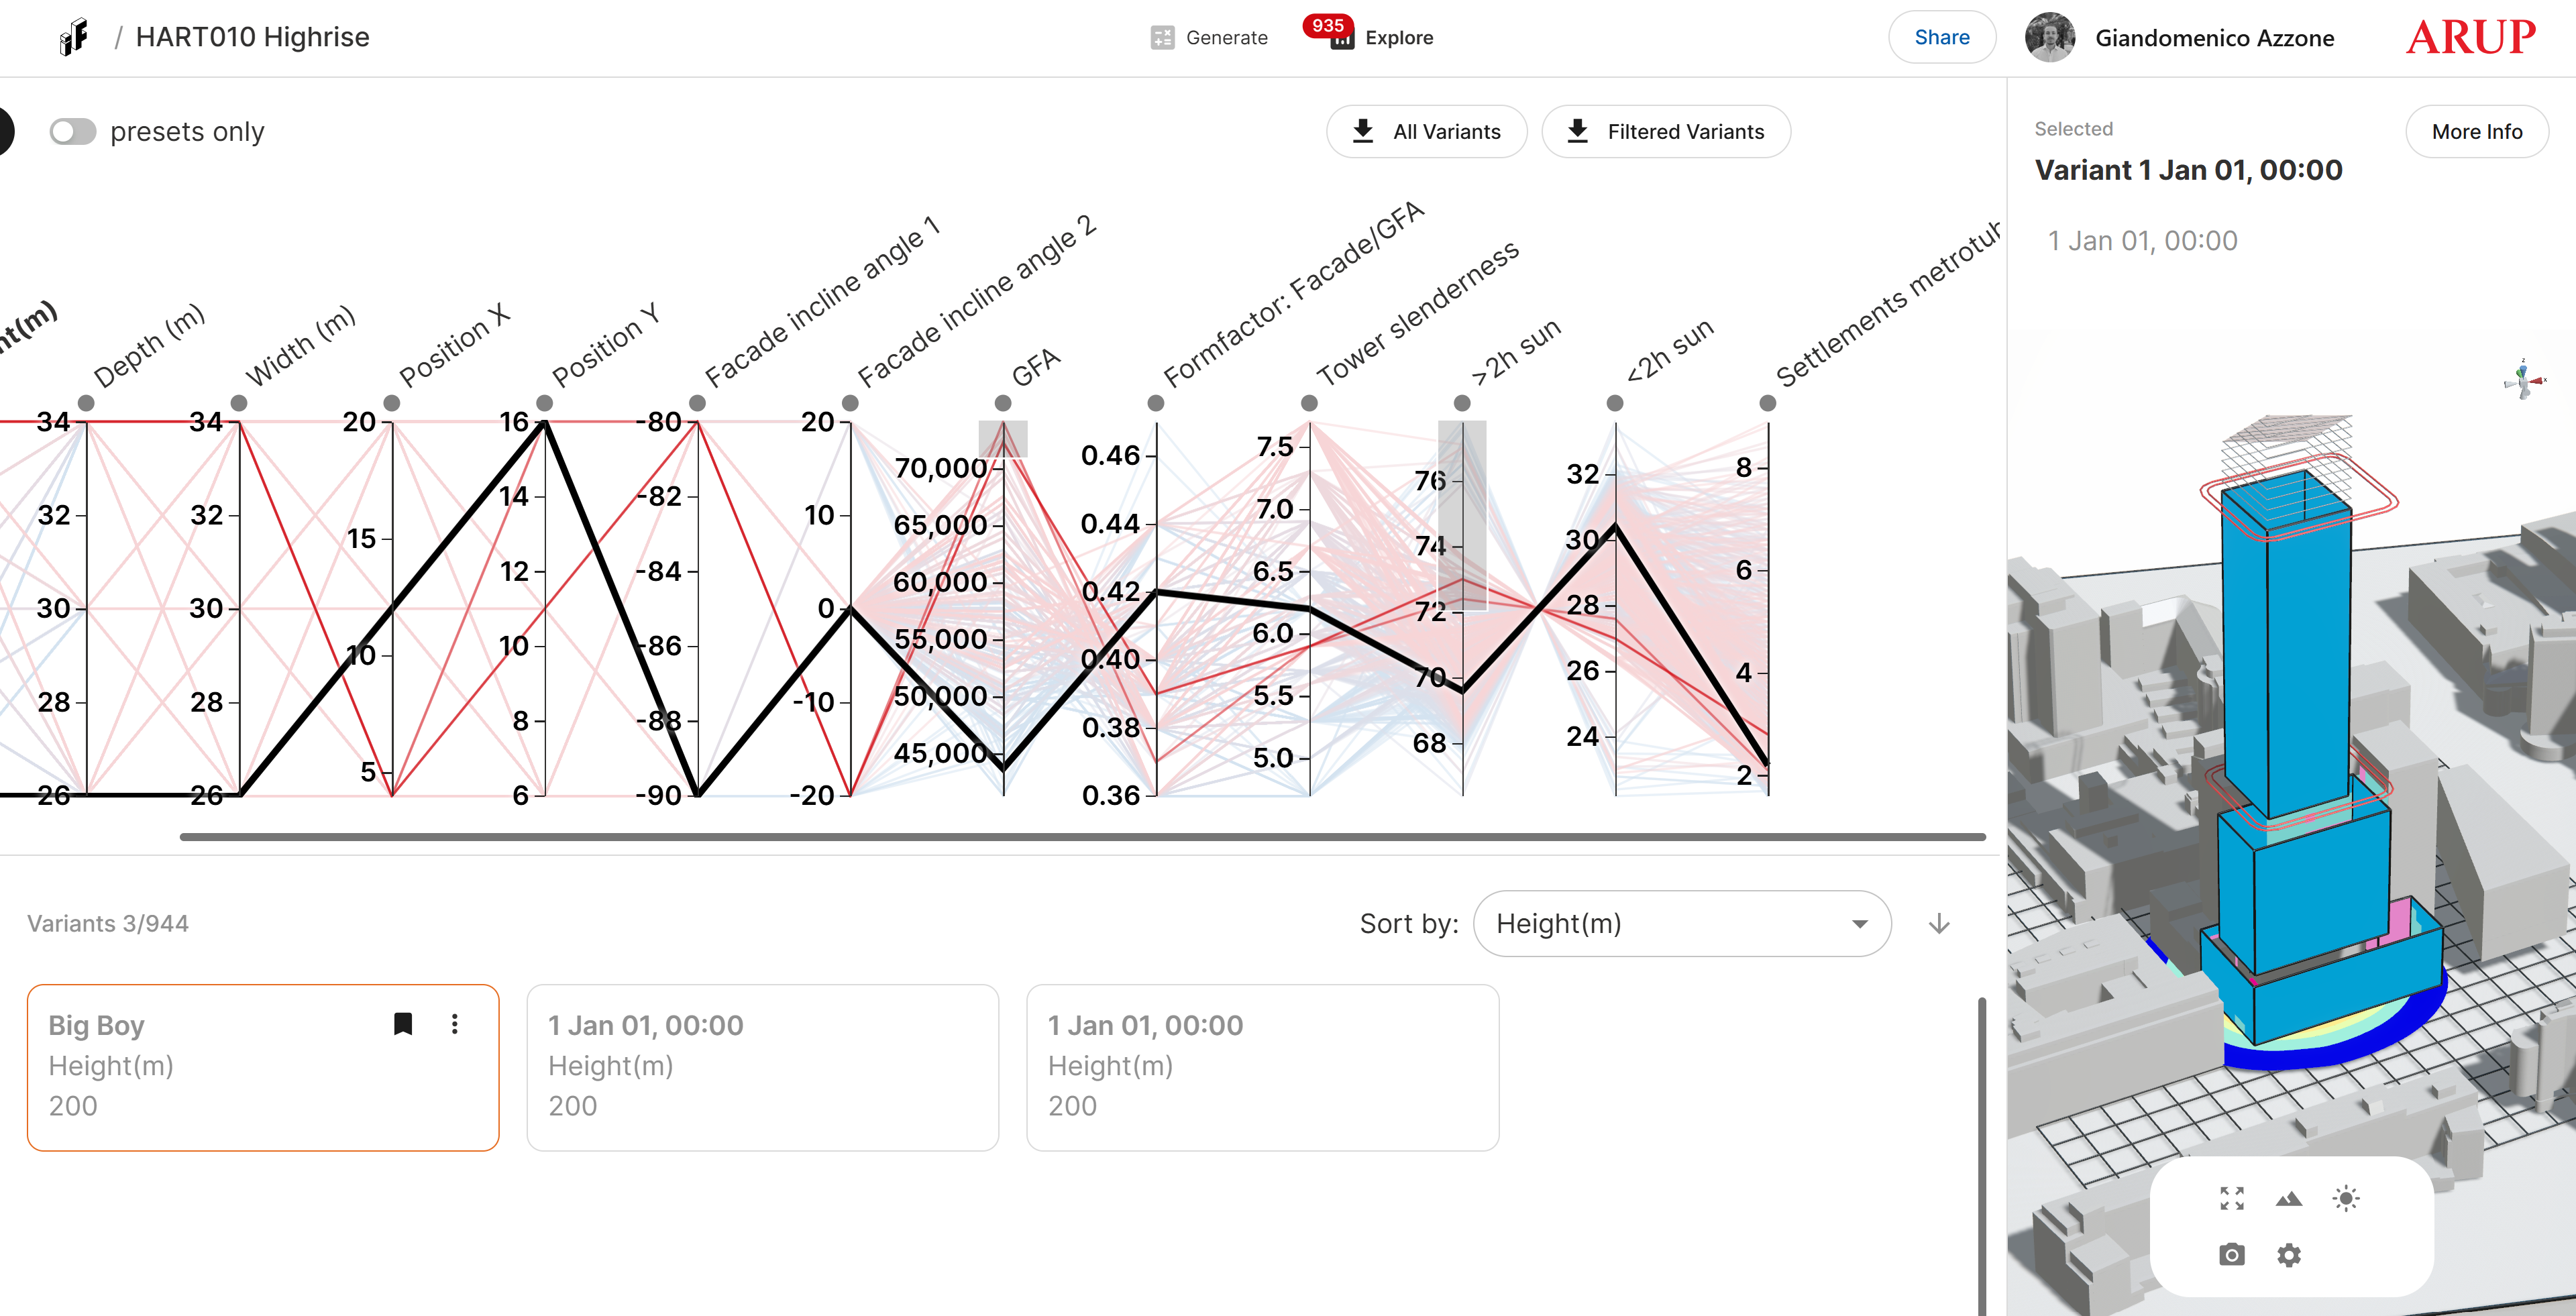
Inspecting Individual Variants
Selecting a variant in the bottom list will:
- Display a preview of the selected variant on the right side
- Highlight the corresponding line in the chart
To inspect the variant in more detail:
- Switch back to Generate
- Review:
- Geometry in the 3D viewer
- Charts and outputs in the right panel
- Input values used to generate that variant
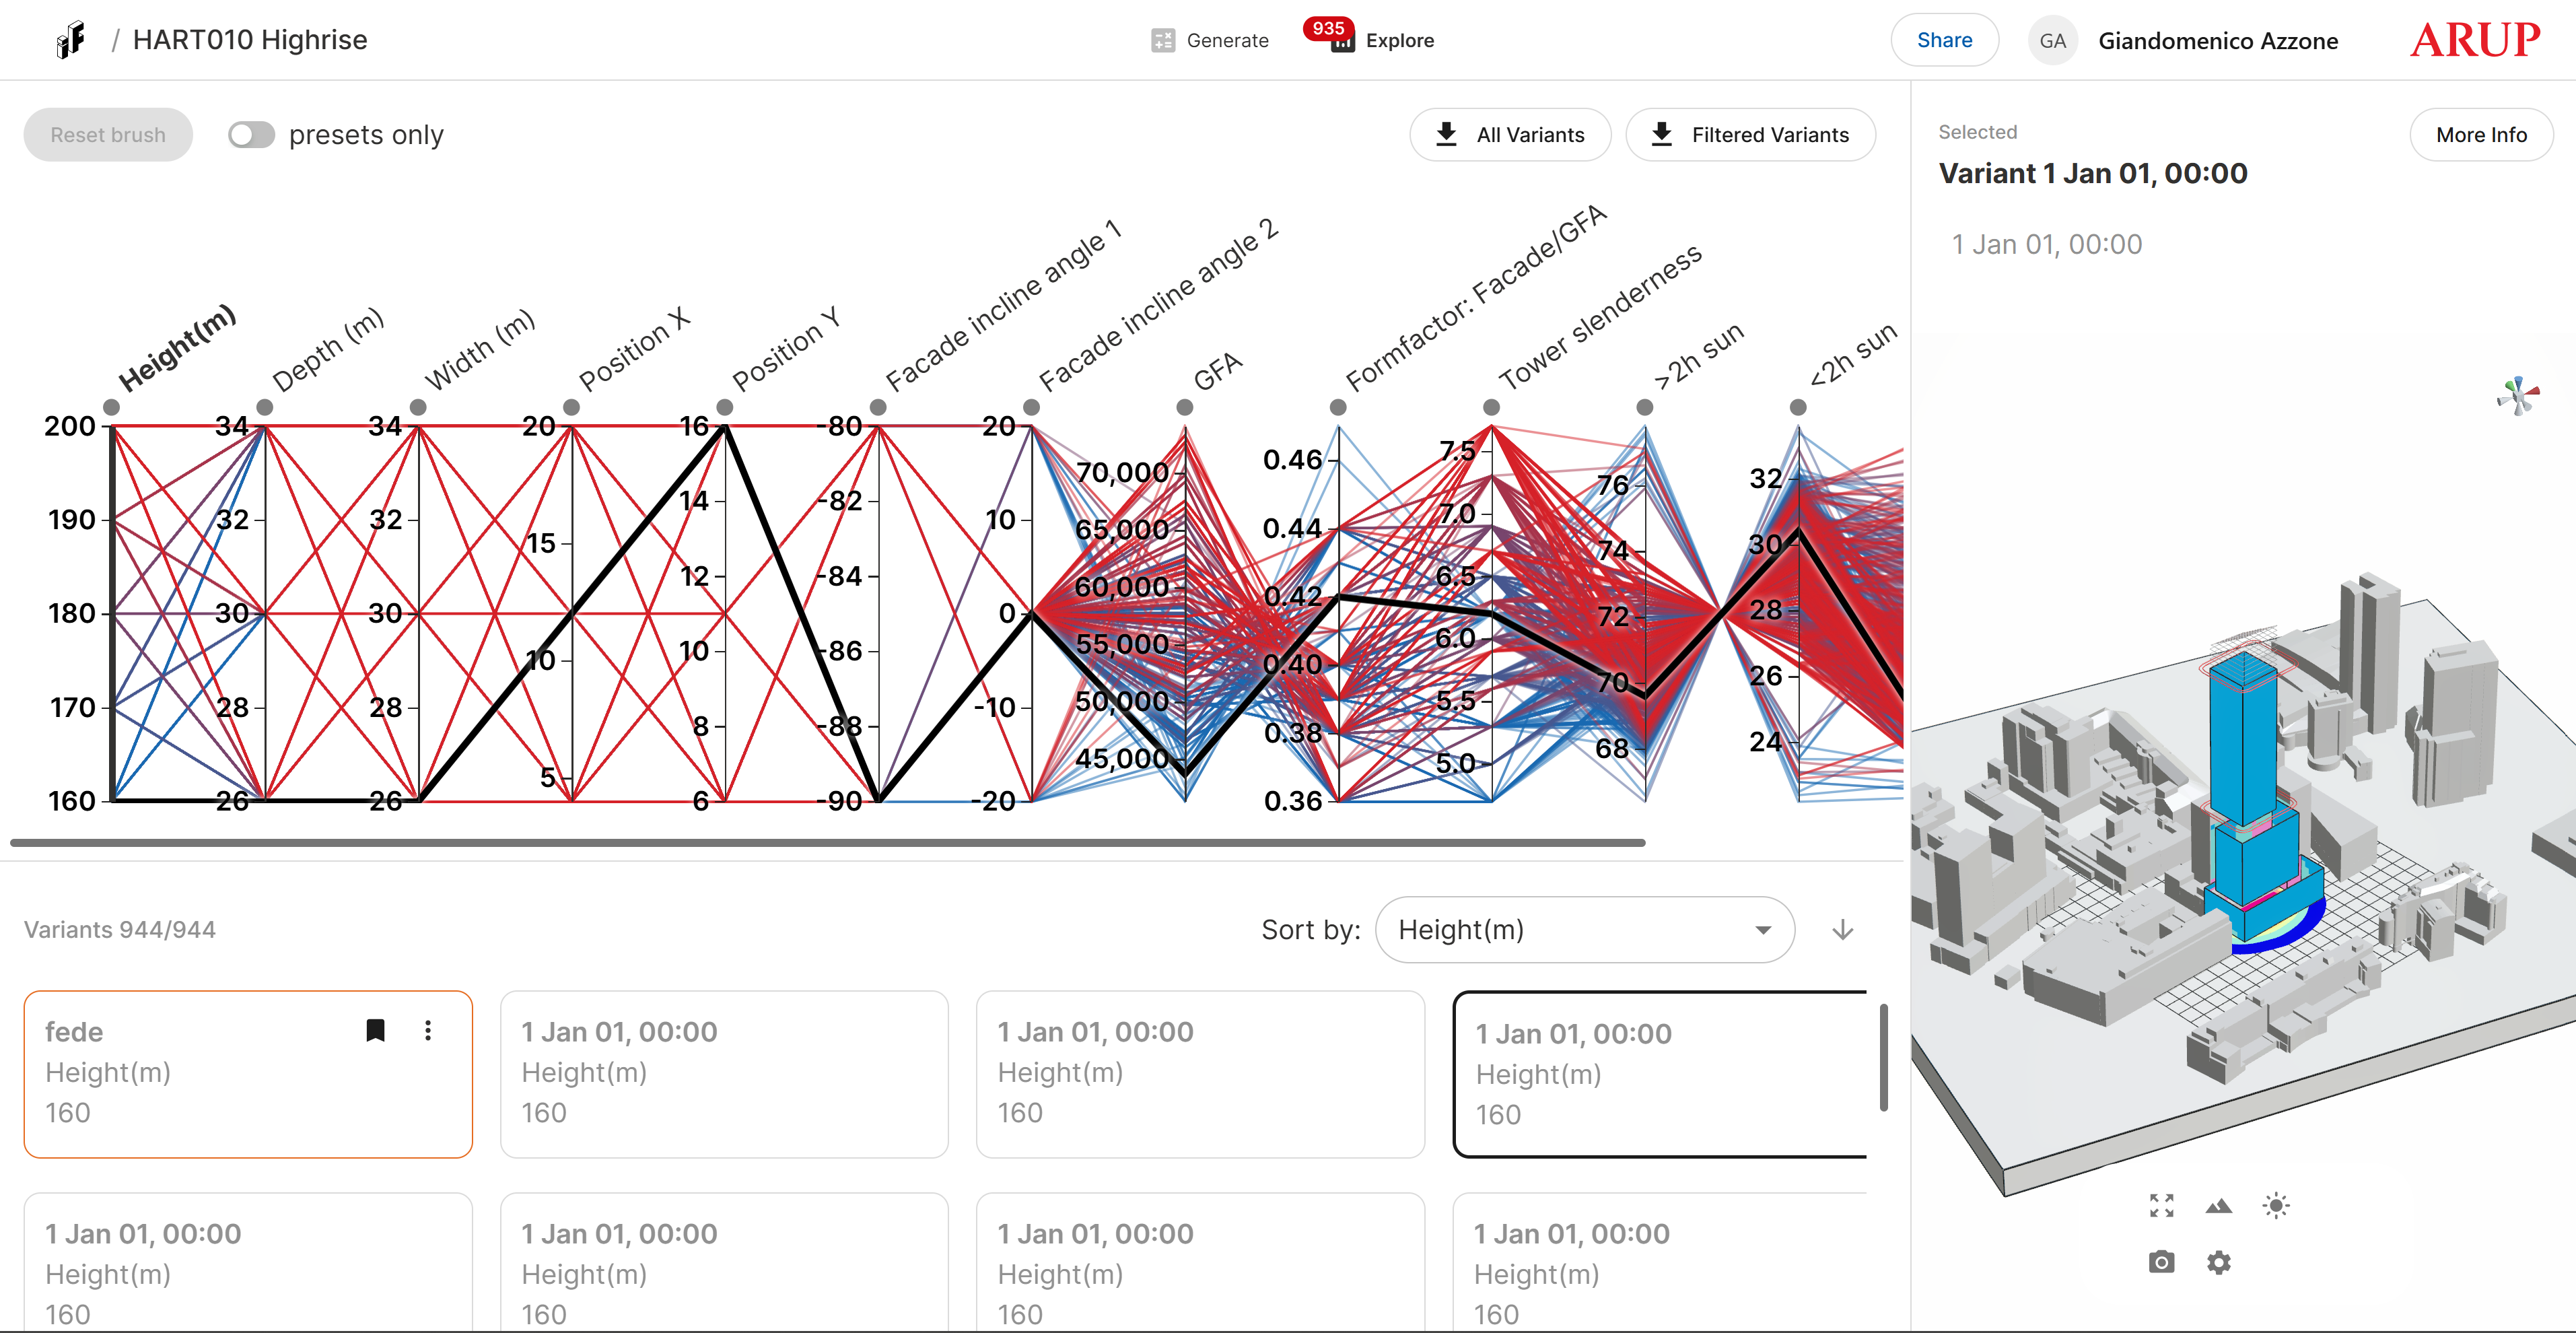
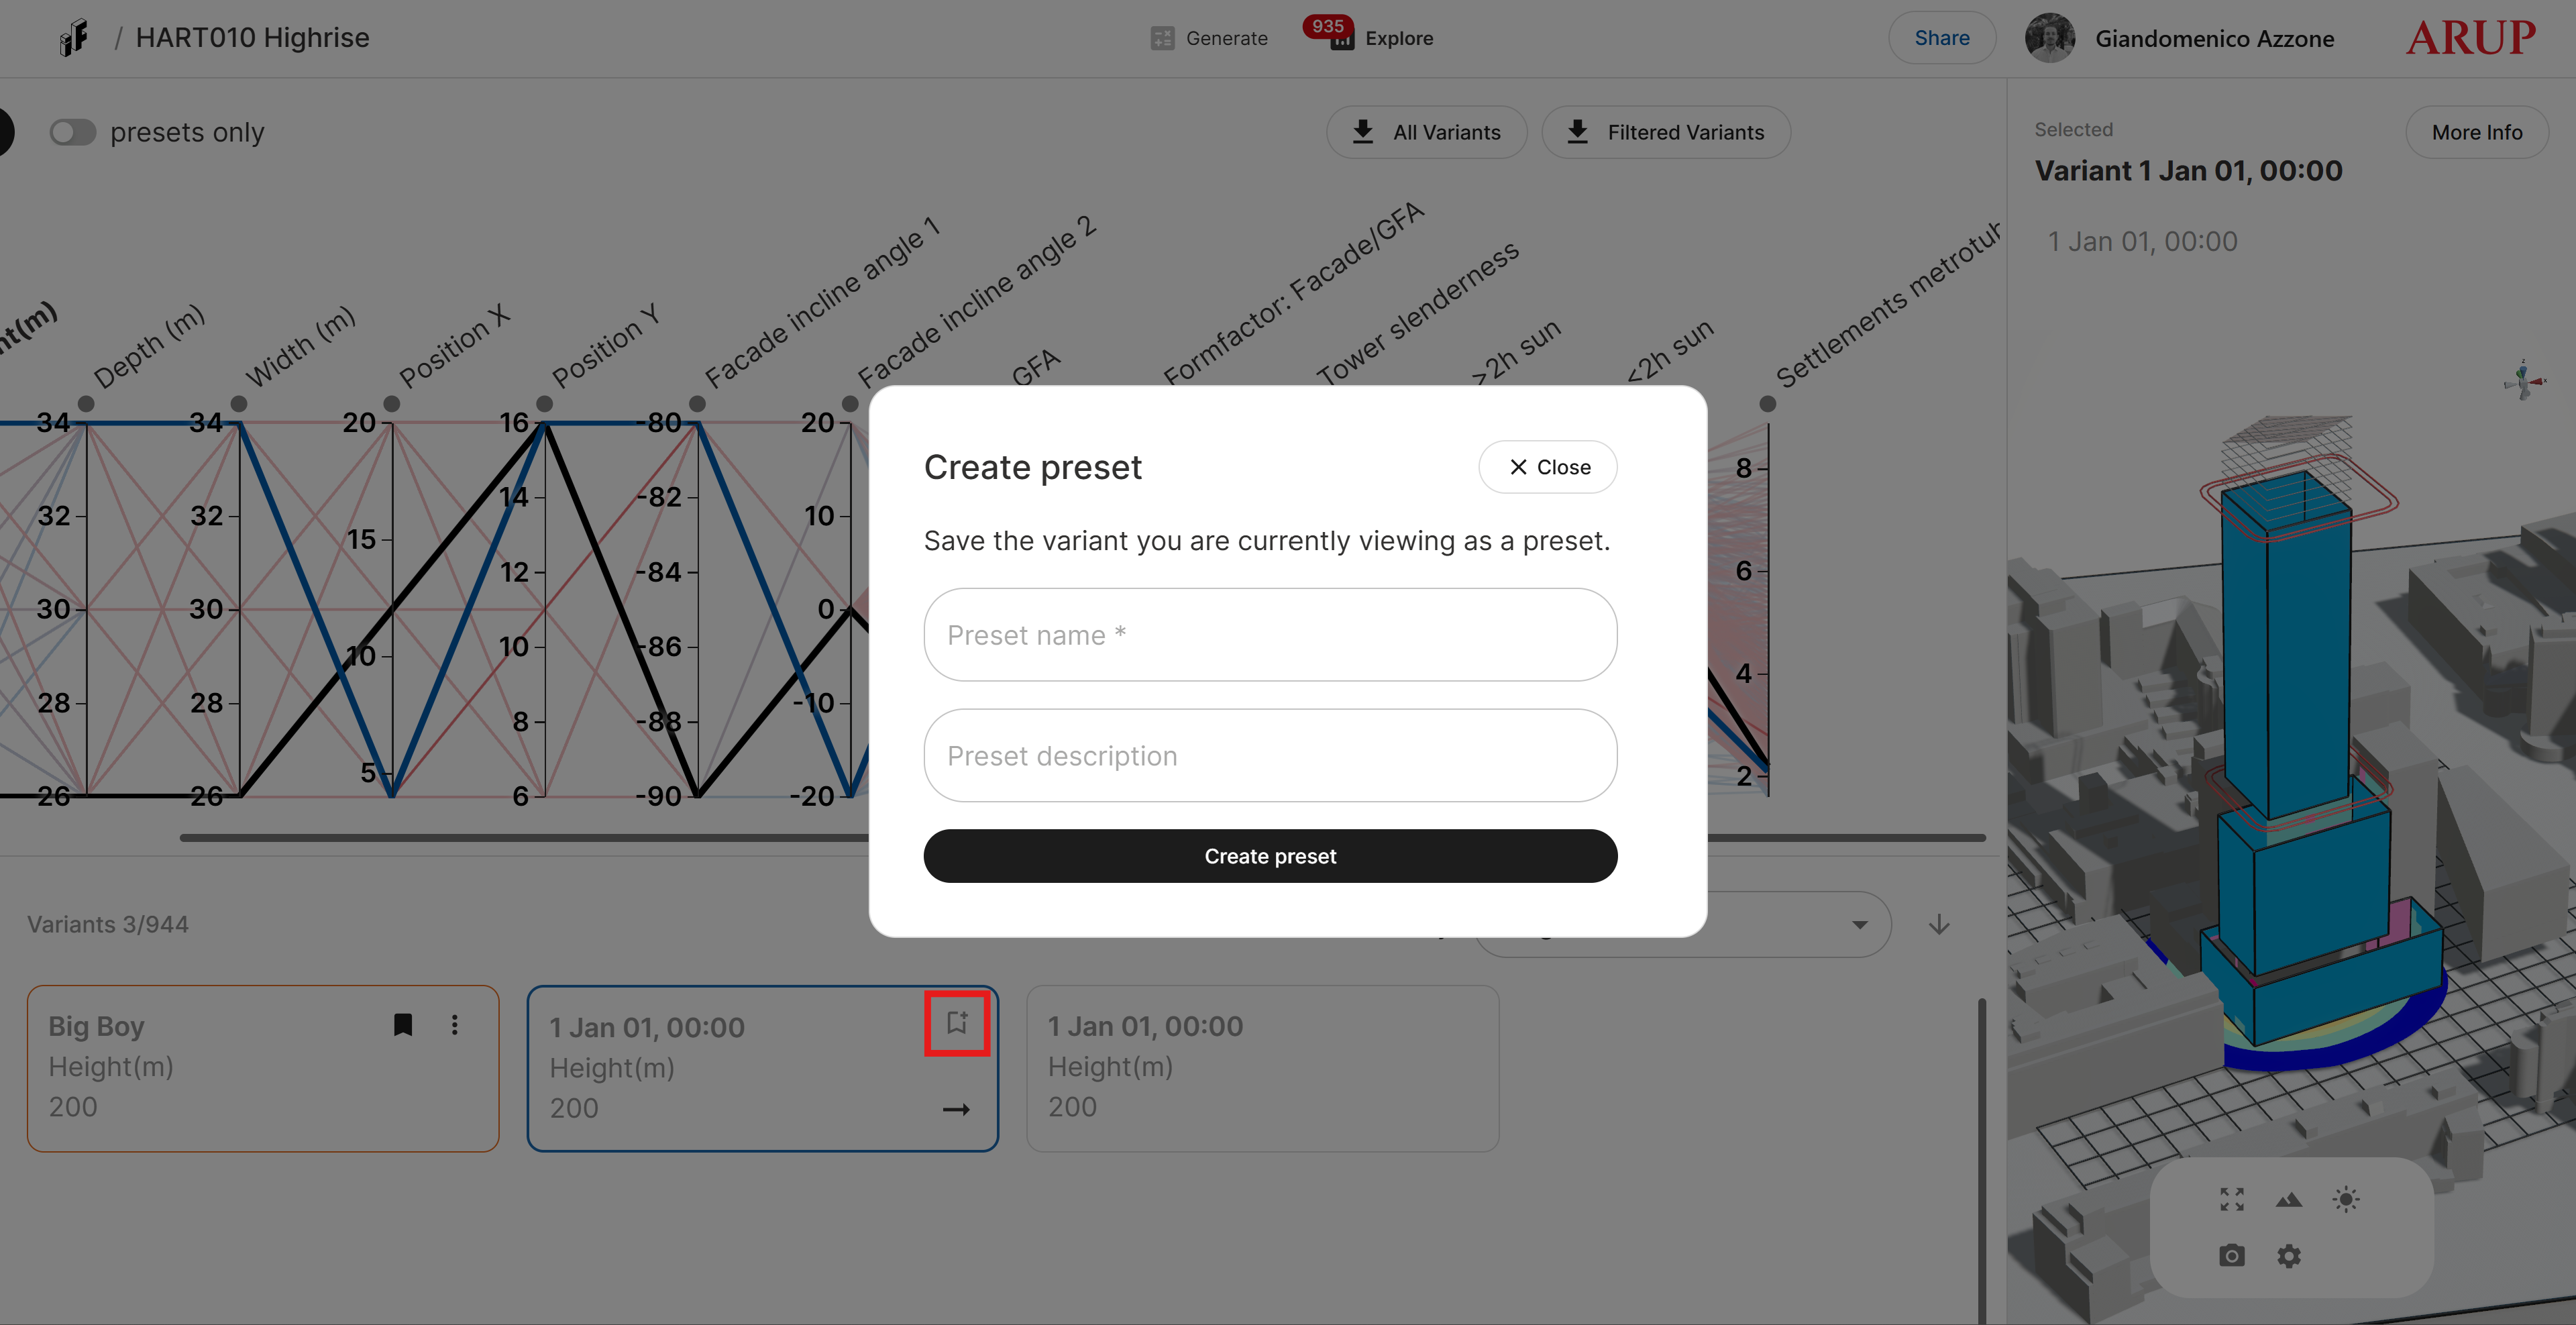
Creating Presets in Explore
Presets allow users to save particularly relevant variants for later comparison.
To create a preset:
- Select a variant in the bottom list
- Click the bookmark icon
- Assign a title and description
Presets created in Explore behave exactly like those created in Generate.
To display only saved presets in the chart, enable the presets only toggle in the top-left corner of the interface.
Downloading Variants
In the top-right corner of the Explore view, it is possible to download a .csv file containing variant data.
You can choose to export:
- All variants currently available in Explore, or
- Only the filtered variants
The exported CSV file includes:
- One column for each ParameterSpace axis
- One row for each variant
This allows further analysis outside InForm (e.g. Excel, Python, BI tools).
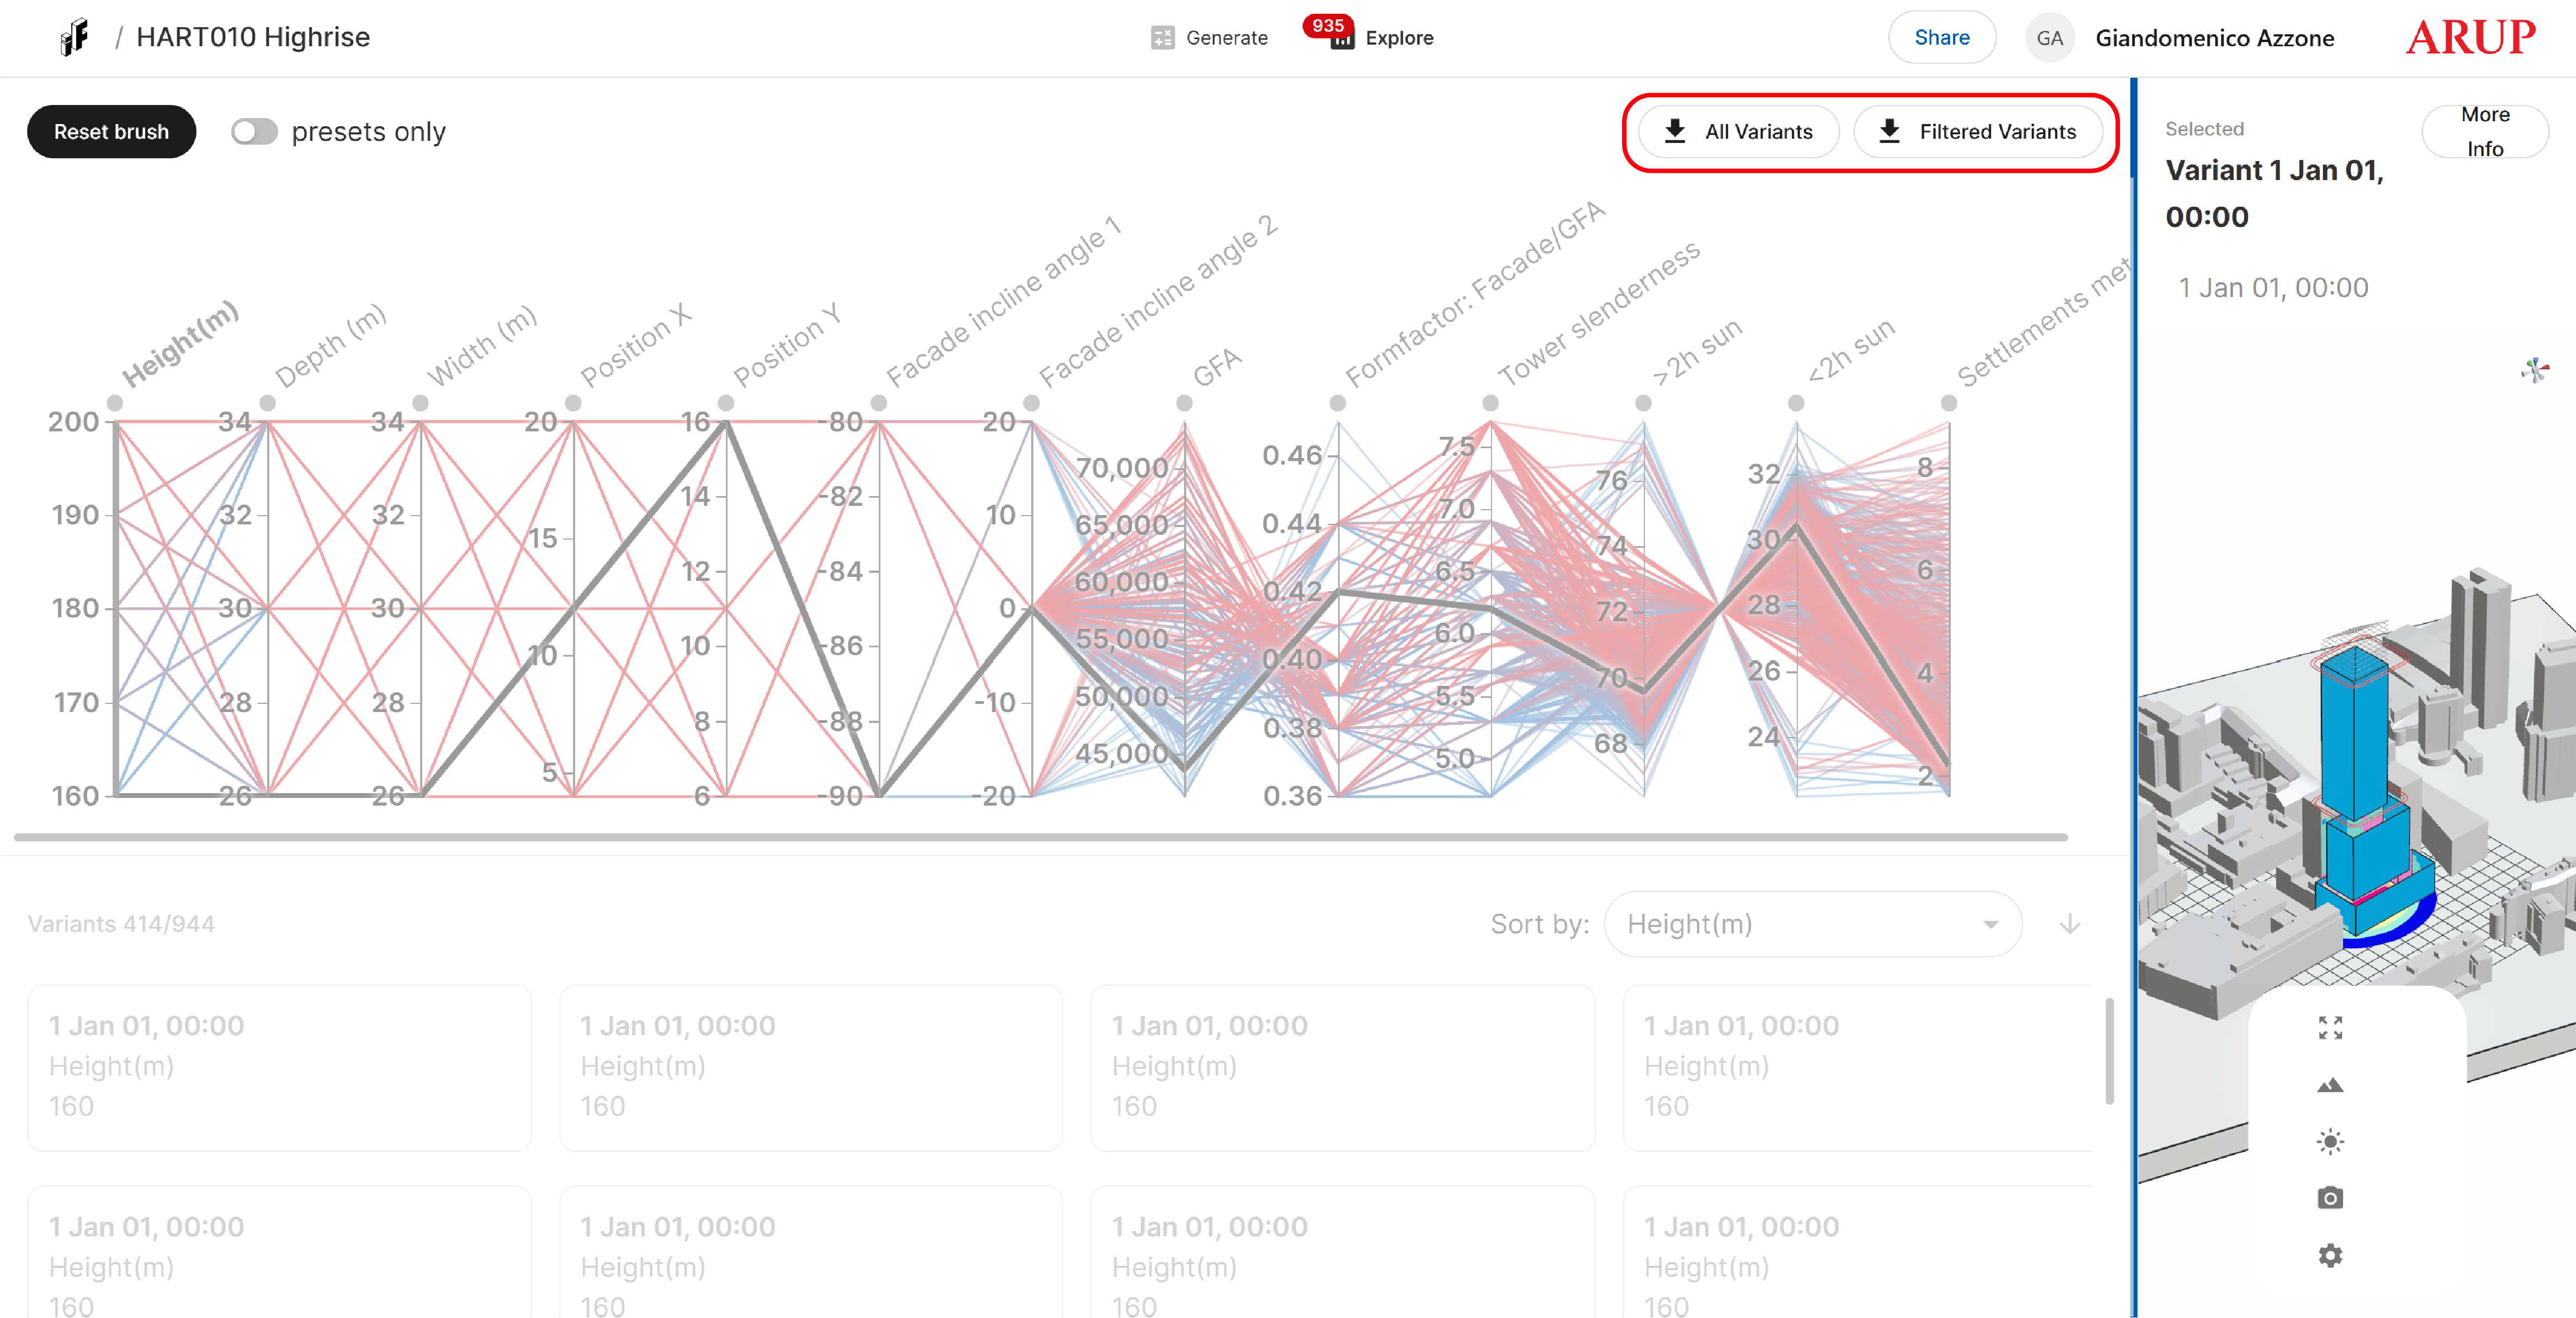
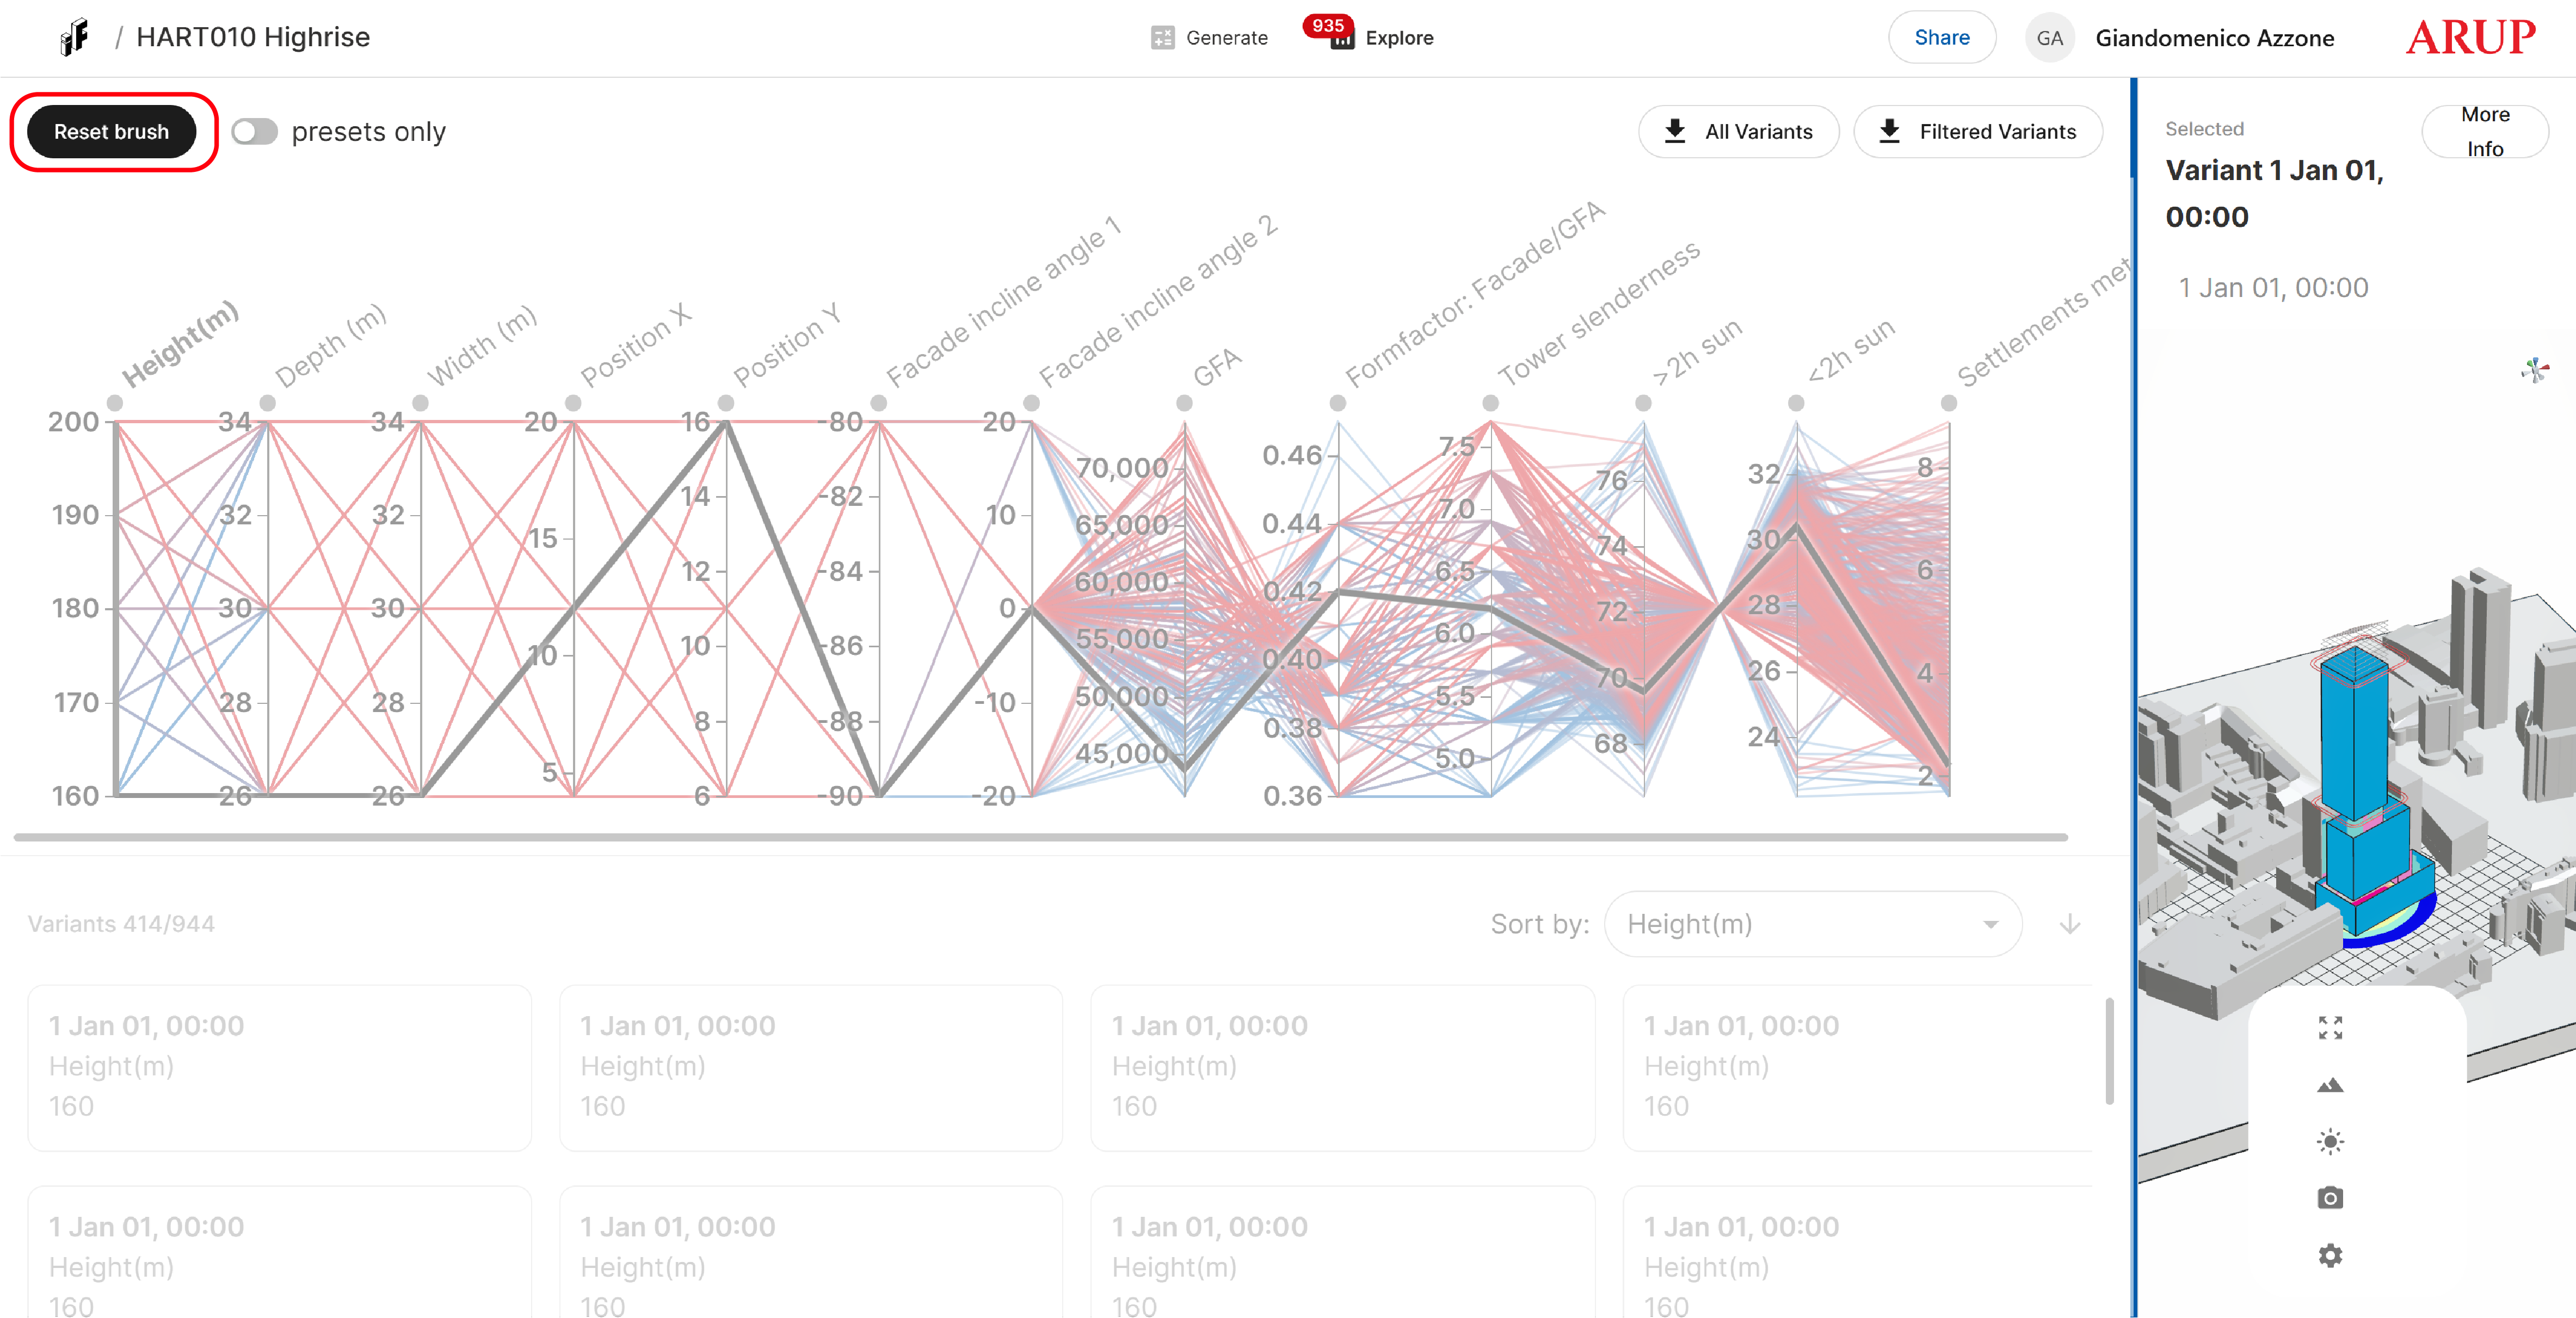
Resetting the View
To remove all active filters and return to the full set of variants:
- Click Reset brush in the top-left corner of the Explore view
This restores the chart and variant list to their unfiltered state.