Scatter (S)
Generate a scatter plot dataset for chart visualization in InForm Scatter datasets can be mixed with bar or line datasets inside the Assemble Chart (AC) component.
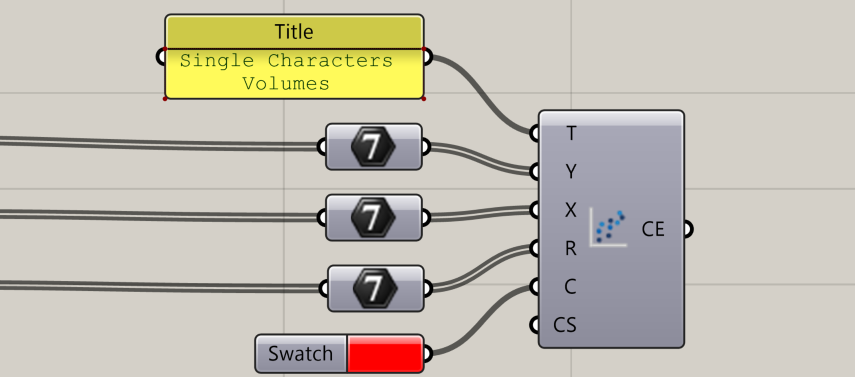
📸 Component Screenshot
📂 Component Location
Tab: 3. Charts
📝 Description
The Scatter (S) component produces a scatter-plot dataset based on X, Y, and optional radius values. It supports colour assignment and advanced JSON overrides compatible with Chart.js.
📁 Example File
🔌 Inputs
| Abbrev. | Full Name | Type | Description |
|---|---|---|---|
| T | Title | Text | Label for the scatter dataset. |
| Y | Y | Number | List of Y-coordinates for the points. |
| X | X | Number | List of X-coordinates. If omitted, indices are used. |
| R | R | Number | List of radii for each point. |
| C | Colour | GH Colour | Optional point colour (RGB). |
| CS | Custom Settings | JSON | Advanced dataset overrides. Ref: https://www.chartjs.org/docs/latest/charts/scatter.html |
🔄 Outputs
| Abbrev. | Full Name | Type | Description | Suggested Connections |
|---|---|---|---|---|
| CE | Chart Element | InForm Scatter Chart | Scatter dataset for chart assembly. | Connect to Assemble Chart (AC) (3. Charts) to display the scatter plot in InForm |