1. Create Parameterspace
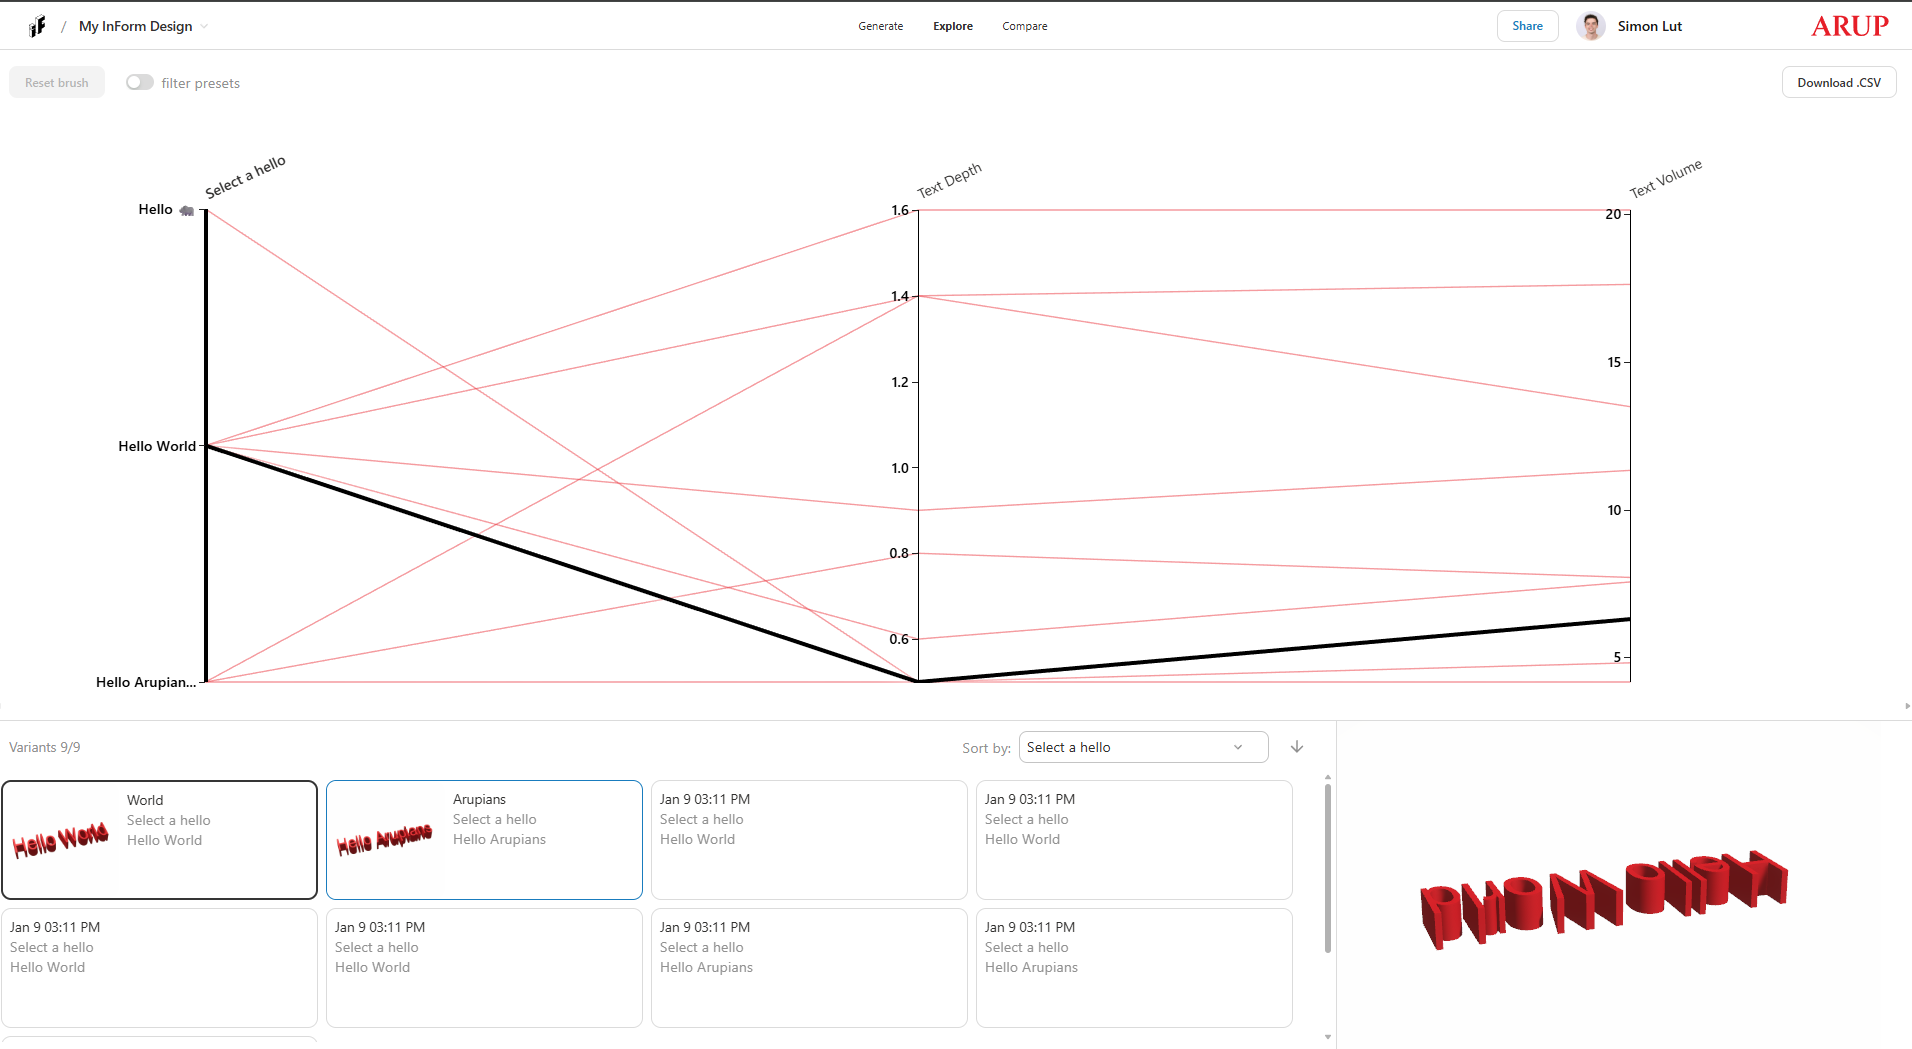
A parameter space is an interactive parallel coordinate plot that visualizes the relationships between all your design inputs and outputs simultaneously. Each vertical axis represents a different parameter (input or output), and each design variant is shown as a line connecting values across all axes.
Key Features
- Visualize Multi-dimensional Data: See how all your parameters relate to each other in a single view, making it easy to identify patterns and trade-offs across your design space.
- Interactive Brushing: Click and drag along any axis to filter designs. You can brush multiple axes to isolate specific ranges—for example, filter designs where cost is low AND performance is high.
- Real-time Selection: As you brush data, the corresponding design variants are highlighted across all axes, helping you understand which combinations of parameters lead to your desired outcomes.
- Explore Trade-offs: Discover how changing one parameter affects others, revealing optimal solutions for your specific constraints.
1. Adding Parameterspace to the example file.
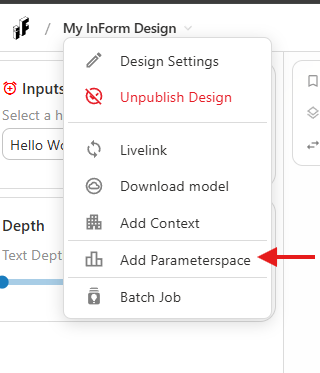
- Select Add Parameterspace from the dropdown.
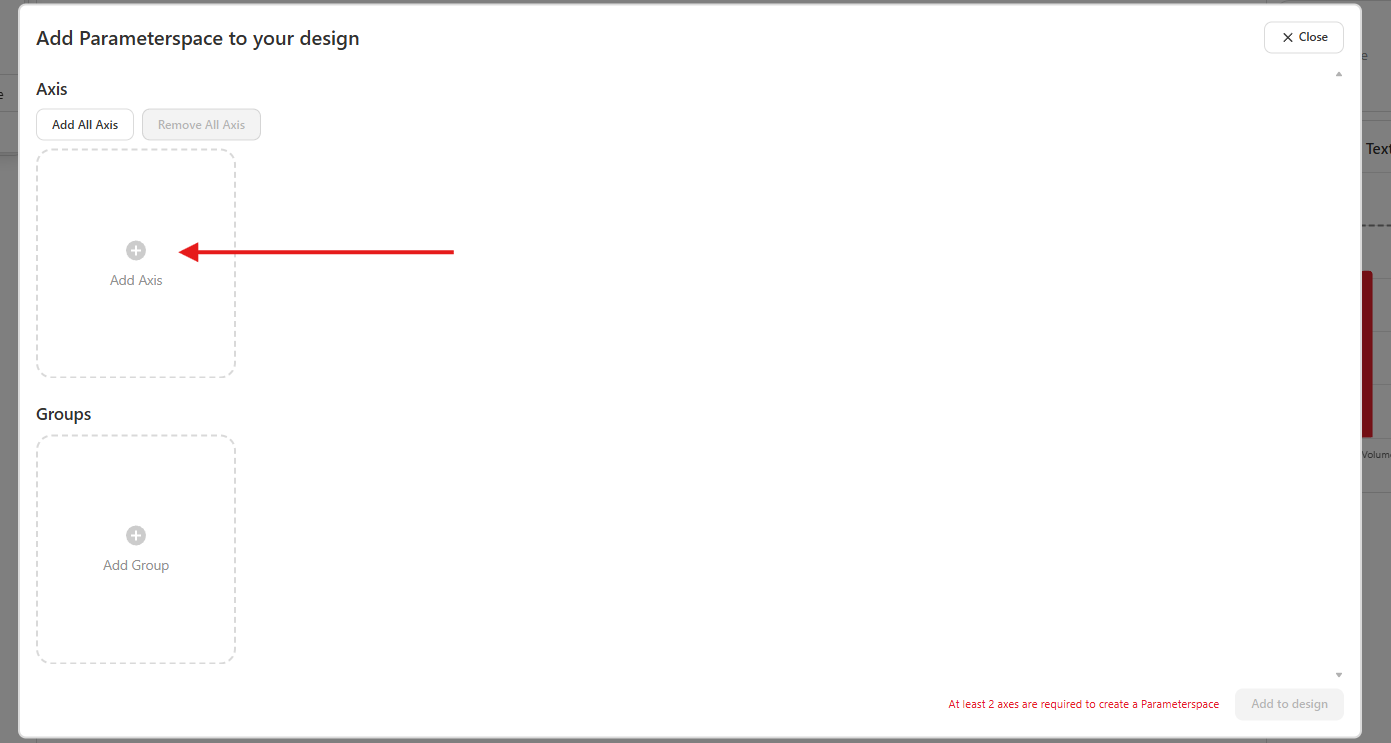
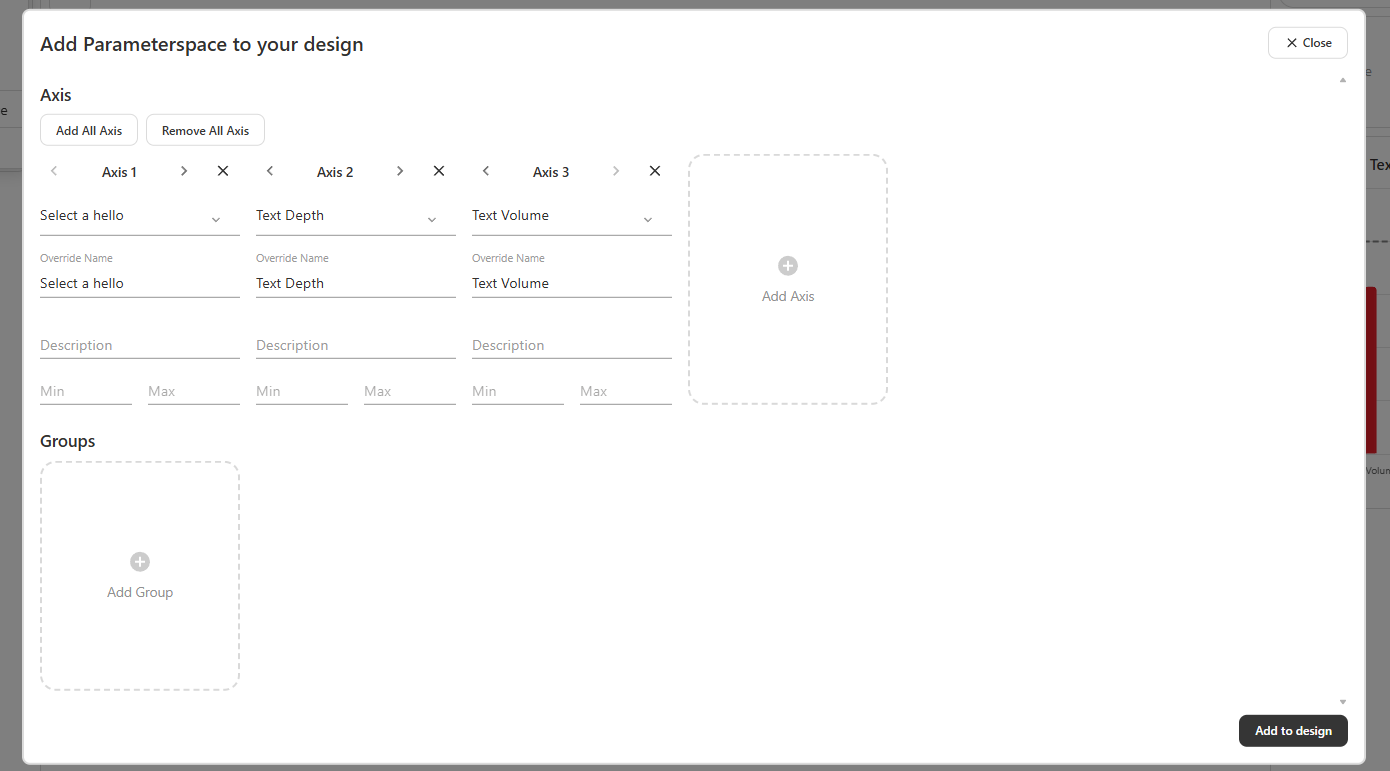
- Click on Add Axis (or add all axis). Select the parameter from the dropdown. These are the same inputs and outputs as we defined in the script.
- Have at least 2 axis and change the name and description (optional). Cick Create design. Reload the page.
- You've successfully added Parameterspace to your project! Every time a new variant is added to the database, it will be shown in the parameterspace.
Next: 2. Add groups and icons